
Macro
Gold, Rates, and the Coming Easing Cycle
May 5, 2026 · 16 min read · Winvestor Analyst Team
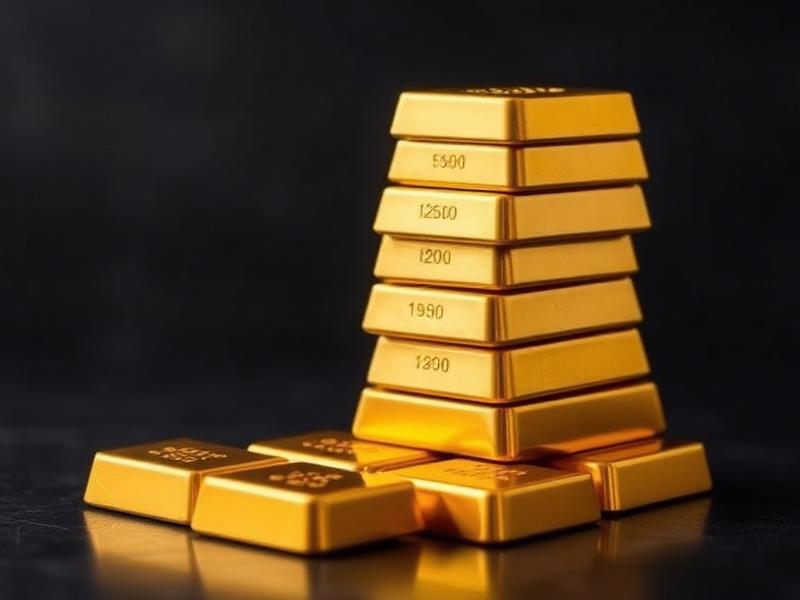
Gold has quietly broken to new all-time highs while real rates remain elevated — a historically unusual combination. We unpack what is driving the move and what it implies for portfolio construction over the next 12-18 months.
The breakdown of the classic gold–real rate relationship
From 2003 to 2022, gold prices moved with near-perfect inverse correlation to U.S. real yields. Since 2023, that relationship has decisively broken. Gold has rallied more than 60% even as 10-year TIPS yields held above 2%. The marginal buyer has changed: central banks, particularly in emerging markets, have absorbed roughly a third of global mine supply for three years running.
Why central banks are buying
The weaponization of dollar reserves following 2022 sanctions accelerated a diversification trend that had been underway for a decade. China, India, Turkey, Poland, and several Gulf central banks have collectively added more than 3,000 tonnes of gold to reserves since 2022. There is no sign this is slowing. Survey data from the World Gold Council shows 29% of central banks plan to increase gold allocations in the next 12 months, the highest reading in the survey's history.
What an easing cycle adds on top
If the Fed begins a measured easing cycle in late 2026 — our base case — real yields likely drift 75-100 bps lower. Layered onto persistent official-sector demand, that historically corresponds to another 15-20% upside for the metal. Miners, which have lagged the metal substantially, offer geared exposure with much better operating leverage than in prior cycles given disciplined capex.
The miners catch-up trade
Gold equities have dramatically underperformed the metal — the GDX/gold ratio sits near generational lows. Yet free cash flow yields at senior producers exceed 8% at current spot prices, balance sheets carry net cash, and capex discipline has held even with the metal at all-time highs. Margin expansion from here flows almost entirely to shareholders. We see scope for 50%+ outperformance versus the metal over the next 18 months if our gold price view plays out.
Western retail and ETF flows remain dormant
One of the more striking features of this rally is what has not happened: Western retail investors and ETF allocators have been net sellers for most of the cycle. Total known ETF gold holdings remain below their 2020 peak. If easing cycles trigger the usual rotation back into gold ETFs — and history strongly suggests they do — this represents an additional layer of demand that has not yet kicked in.
Portfolio implications
We have raised our strategic allocation guideline for gold from 3% to 5% of a balanced equity portfolio. The argument is less about a single-year return forecast and more about correlation: gold remains one of the few assets with reliably negative correlation to equities during deep drawdowns, and that property is increasingly scarce.
Risks to the constructive view
A genuine policy resolution that meaningfully reduces geopolitical fragmentation would slow central bank demand. A sudden, hawkish Fed pivot would compress the easing trade. And gold remains a momentum-prone asset — a 10-15% drawdown from current levels is well within historical norms even within a structural bull market. We size positions to tolerate that volatility without forced selling.